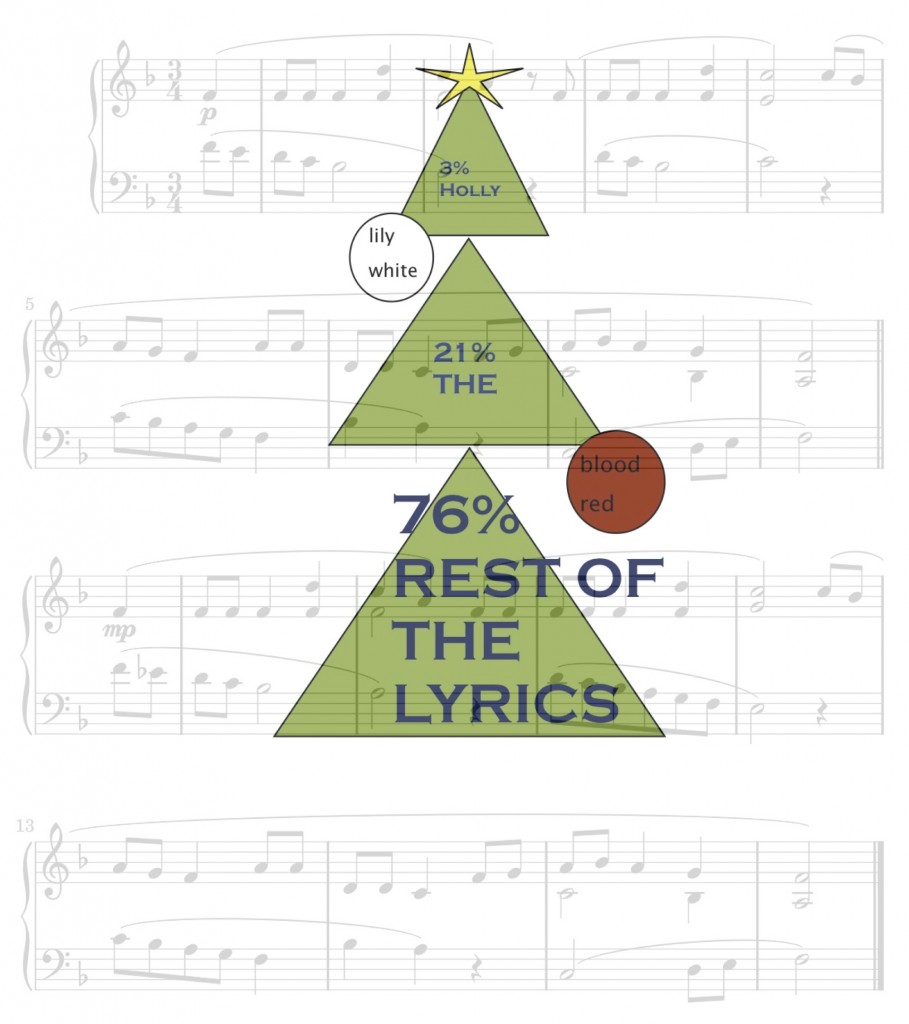
Infographics are a popular way of representing information in a visual way. Mashable.com regularly posts infographics on a wide variety of topics, and there is advice on creating infographics in this article on makeuseof, which also lists some useful tools. This infographic was created using Pages and Inkscape on a Mac, although they can be created with any graphics packages. Some services can create infographics for you – like this twitter infographic tool from visual.ly – why not try it?
Post comment
Calendar of posts
Recent Posts
- Festive 24 Things 2011 answers
- We have a winner!
- Enter the Festive 24 Things 2011 quiz
- Red man en route to borough
- Willoughby dines out
- Give Attention to the Melodious Celestial Beings
- Swingin’ around and around the richest master
- Proceed and enlighten on the pinnacle
- Arrival time: 2400 hours; Weather: cloudless
- 1066 and all that describes monarch in unorthodox Czech landmark
- New born Nick
- Musical slogan advertises whisky
- Parent was observed oscillating a red coated unshaven teamster
- Castaneous coloured seed vesticated in a conflagration
- Bidding everyone festive joy
- The dozen festive 24 hour intervals
- I heard ugly sisters: Nancy, Moira and Princess Charlotte
- Bantam male percussionist
- Singular yearning for twin anterior incisors
- The quadruped with vermilion proboscis
- Obese personification fabricated of compressed mounds of minute crystals
- Monarchical triad
- Bleached Yule
- Sound of Tinkerbell’s end from the big apple
- Righteous Darkness
Tags
animoto
avatar
Babelfish
blogs
Creately
Delicious
dogs
elf yourself
Etsy
Flickr
flickr montager
gallery
google earth
google maps
google search stories
google tasks
google translate
igoogle
image chef
infographic
jing
LibraryThing
mashup
pinterest
pop up book
rss
screencast
screentoaster
social bookmarking
stack
tagexdo
tags
tagxedo
Twitter
twtpoll
uksnow
voki
winner
word cloud
wordsearch
xmas joke
xtranormal
yeti sports
youtube
zooburst
 Posted in
